


Top Board Reporting Dashboards for Risk & Compliance Leaders in 2025

Join thousands of professionals and get the latest insight on Compliance & Cybersecurity.
In boardrooms across industries, risk and compliance leaders face a common frustration: creating security dashboards that genuinely inform decision-making rather than simply looking pretty. As one security professional bluntly puts it, "Management loves flashy colors. But I'll be damned if they know what any of it means."
This disconnect between appealing visuals and actionable insights isn't just annoying—it's dangerous. By 2025, with cyber threats more sophisticated and regulations more stringent than ever, boards need more than just "pretty pictures." They need actionable risk intelligence that drives strategic decisions.
Why Most Board-Level Dashboards Fail: The Vanity Metrics Trap
Many dashboards fail because they prioritize appearance over substance. They're filled with what security professionals call "vanity metrics"—impressive-looking numbers that don't actually drive decisions or reduce risk.
For example, consider the classic "total vulnerability count" metric. As one Reddit user points out: "What happens when someone looks the day after Patch Tuesday and the number spikes? Does that mean security is worse? Of course not."
The truth is stark: "Dashboards are great to throw on a big screen for visitors, but I'm yet to see one prevent an actual attack in any meaningful way," notes another security professional. This sentiment reflects the widespread frustration with dashboards that impress but don't protect.
Effective dashboards must answer the critical question: "What action can each metric help produce?" Every data point should spark a specific decision or intervention; otherwise, as one expert puts it, "showing numbers just because does a disservice to your effort."
Anatomy of an Effective Board Reporting Dashboard
A truly valuable risk and compliance dashboard goes beyond aesthetics to deliver actionable intelligence. According to MetricStream, effective dashboards transform "compliance data into actionable intelligence for better risk management."
Essential features that every board-level dashboard should include:

- Real-Time Updates: For regulated industries, monthly or quarterly updates are insufficient. Near real-time data is essential for dynamic risk management.
- Drill-Down Capabilities: The board needs high-level summaries, but your team must be able to instantly access detailed data to answer follow-up questions.
- Clear Visual Cues: Simple indicators like red/amber/green status help "quickly identify compliance issues" without overwhelming the board with technical details.
- Configurable & Shareable: Dashboards must be easily exportable in formats suitable for board packs and presentations.
Now, let's examine the four essential dashboards every risk and compliance leader should include in their 2025 board pack.
The 4 Essential Dashboards for Your 2025 Board Pack
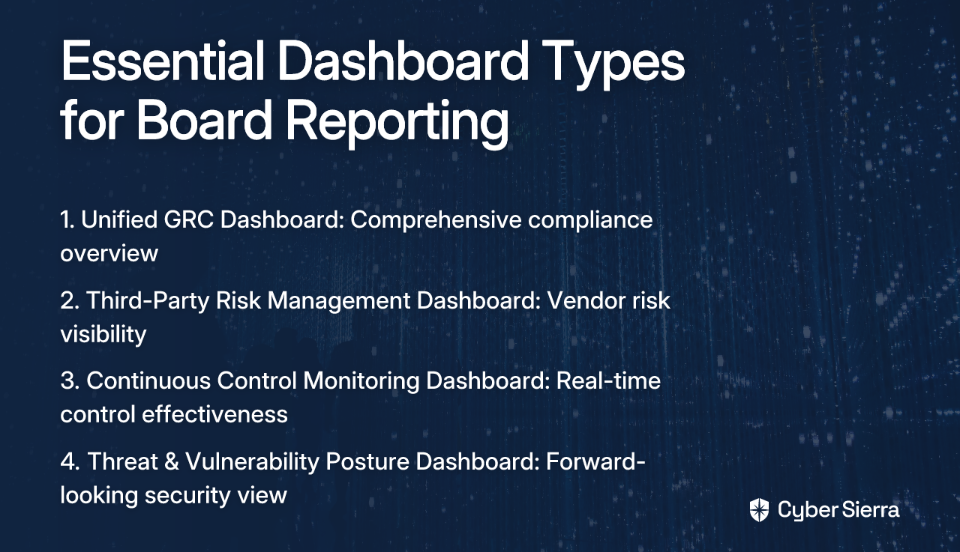
1. The Unified Governance, Risk, and Compliance (GRC) Dashboard
Purpose: Provides a single-pane-of-glass view of your organization's compliance with key regulations and internal policies.
Key Metrics to Include:
- Overall Compliance Posture: A high-level score or red/amber/green status that immediately communicates your organization's compliance health.
- Compliance Level by Regulator/Framework: Visual breakdown showing adherence across different standards (GDPR, HIPAA, SOC 2, ISO 27001) to identify specific areas of non-compliance.
- Policy & Training Compliance: Employee policy acknowledgment and security training completion rates. As one security professional notes, "Training compliance and awareness is probably the most effective [metric] honestly."
- Open Issues & Violations: Track outstanding compliance issues with clear ownership and remediation timelines.
2. The Third-Party Risk Management (TPRM) Dashboard
Purpose: To identify, assess, and monitor risks posed by vendors and partners. This is increasingly critical as "35% of directors are worried about third-party data breaches," according to research from PwC.
Key Metrics to Include:
- Vendor Risk Heatmap: Visually prioritize vendors based on criticality and risk exposure.
- Average Risk Rating by Vendor Tier: Strategic view of risk across different vendor categories.
- Vendor Assessment Status: Track the progress of vendor onboarding and periodic reviews against required timelines.
- Fourth-Party Risk Exposure: Highlight critical subcontractors or dependencies within your supply chain.
3. The Continuous Control Monitoring (CCM) & Audit Readiness Dashboard
Purpose: To shift from manual, point-in-time audit evidence collection to automated, continuous validation of security controls.
Key Metrics to Include:
- Control Operating Effectiveness: Real-time status (effective, ineffective, needs review) of critical security controls.
- Control Failures & Exceptions: Immediate alerts on control anomalies or failures.
- Audit Finding Remediation: Track the status of corrective actions from internal and external audits.
- Evidence Collection Automation Rate: Measure the percentage of compliance evidence gathered automatically versus manually, demonstrating efficiency gains.
4. The Proactive Threat & Vulnerability Posture Dashboard
Purpose: To provide a forward-looking view of the organization's attack surface and vulnerability management effectiveness.
Key Metrics to Include:
- Top 10 Risks (Inherent vs. Residual): Show the board where the biggest risks lie and how effective your mitigating controls are.
- Mean Time to Remediate (MTTR) by Criticality: Measure the speed of patching for vulnerabilities by severity level.
- Vulnerability Age Distribution: Chart showing how many critical vulnerabilities are over 30, 60, or 90 days old.
- Overall Security Scorecard: A consolidated score that provides a holistic view of your organization's attack surface and security posture.
From Data to Decisions: How to Implement Actionable Dashboards
Creating truly effective dashboards requires more than technical know-how—it demands strategic alignment with business objectives. Here's how to build dashboards that drive decisions, not just discussions:
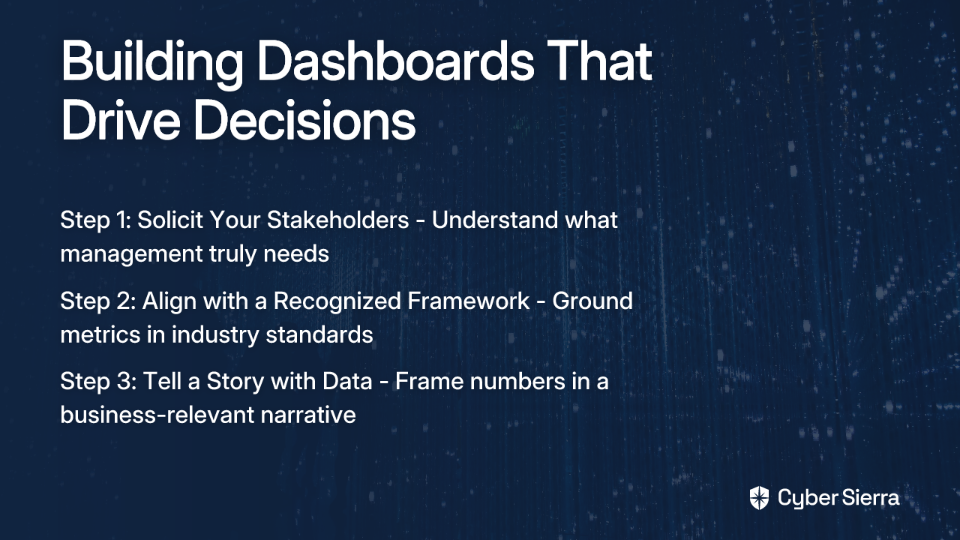
Step 1: Solicit Your Stakeholders Before building anything, follow this key advice from the cybersecurity community: "Go solicit your stakeholders (management) for what they need." Ask board members what business risks keep them up at night—then design dashboards that address those specific concerns.
Step 2: Align with a Recognized Framework Ground your metrics in industry standards like NIST, ISO 27001, or CIS. This provides credibility and ensures you're measuring what matters from a compliance perspective.
Step 3: Tell a Story with Data Don't just present numbers—frame them in a narrative that explains what the data means for business objectives and risk appetite. Your dashboard should help educate the board while providing actionable insights.
The Future is Integrated: Why Spreadsheets and Siloed Tools Fall Short
Many organizations, especially smaller ones, resort to spreadsheets for GRC tracking. As one professional notes: "You can build risk registers, checklists and process trackers in your spreadsheet of choice." But this approach creates significant problems:
- Creates data silos between departments
- Relies on manual updates that are error-prone
- Offers zero real-time visibility
- Provides no automated alerting capabilities
An integrated platform breaks down these silos, providing a single source of truth where data flows into cohesive, interconnected dashboards.

This is where solutions like Cyber Sierra become valuable. As an AI-enabled cybersecurity platform, it unifies the various components needed for comprehensive board reporting:
- The GRC module automates data collection and reporting for frameworks like SOC 2 and ISO 27001, populating the GRC dashboard automatically.
- The TPRM module offers continuous vendor monitoring beyond static questionnaires, providing live data for the third-party risk dashboard.
- The Continuous Control Monitoring (CCM) module maintains a central controls repository with near real-time updates, making audit readiness a continuous state rather than a frantic project.
- The Threat Intelligence module performs ongoing vulnerability scanning to power a dynamic view of your attack surface.
Conclusion: Empowering the Board with True Risk Insight
The era of static, "pretty picture" dashboards is over. In 2025, effective leadership demands dynamic, actionable, and integrated risk intelligence. The goal is to move from merely reporting on the past to actively shaping your organization's future resilience.
By focusing on actionable KPIs, leveraging automation, and adopting a unified platform approach, risk and compliance leaders can transform their board reporting from a tactical burden into their most powerful strategic tool.
Remember what one security professional wisely observed: "Risk reduction velocity is what actually matters. Most metrics are vanity numbers if they don't translate to fewer exploitable attack paths." The dashboards outlined in this guide are designed to deliver exactly that: measurable risk reduction that the board can understand and act upon.
Frequently Asked Questions (FAQ)
What is the main problem with most security dashboards?
The main problem is that they focus on "vanity metrics"—numbers that look impressive but don't provide actionable insights to reduce risk. For example, a raw count of vulnerabilities can be misleading without context. Effective dashboards shift the focus to actionable metrics that help leaders make specific decisions to improve security posture.
What are the essential components of an effective board-level dashboard?
An effective board-level dashboard provides a high-level, real-time view of risk, includes clear visual cues like color-coding (red/amber/green), and allows users to drill down for more detail when needed. It should also be configurable and easy to share in formats suitable for board presentations.
How can I make my security metrics understandable to a non-technical board?
To make security metrics understandable, frame them as business risks and tell a story with the data. Instead of just presenting numbers, explain what they mean for the company's risk appetite and strategic goals. Aligning your metrics with a recognized framework like NIST or ISO 27001 also adds credibility and context that a board can appreciate.
Why is a unified GRC platform better than using spreadsheets for risk management?
A unified GRC platform is better than spreadsheets because it provides a single source of truth, automates data collection, offers real-time visibility, and eliminates error-prone manual updates. Unlike spreadsheets, which create data silos, an integrated platform connects different risk areas to provide a cohesive, accurate, and always-current view of your compliance and security posture.
What are the four key dashboards every board needs to see in 2025?
The four essential dashboards for 2025 provide a comprehensive view of risk and cover: 1) Unified Governance, Risk, and Compliance (GRC) for overall compliance health, 2) Third-Party Risk Management (TPRM) to monitor vendor risk, 3) Continuous Control Monitoring (CCM) for automated control validation, and 4) Proactive Threat & Vulnerability Posture to manage the attack surface.
How do I get started with building actionable security dashboards?
The first and most critical step is to solicit your stakeholders, particularly board members and management, to understand what business risks they are most concerned about. Once you know their priorities, you can design dashboards that directly address those concerns, ensuring the information you present is relevant and drives strategic decisions.

Ready to build board reports that drive decisions, not just discussions? Schedule a demo with Cyber Sierra to see how an integrated platform can provide a single source of truth for your risk and compliance program.