


How to Visualize Security Control Relationships Across Your Infrastructure
Join thousands of professionals and get the latest insight on Compliance & Cybersecurity.
Summary
- Fragmented data and overlapping compliance frameworks make it difficult for security teams to visualize their control posture, leading to audit fatigue and compliance gaps.
- Effective visualization helps eliminate redundant compliance work, accelerates audit readiness, and proactively identifies security gaps before they become issues.
- A practical approach involves centralizing all security controls and implementing Continuous Control Monitoring (CCM) for near real-time visibility.
- An integrated platform like Cybersierra's Continuous Control Monitoring automates control mapping and monitoring, providing a single source of truth for security and compliance.
You've implemented a robust set of security controls across your organization. You're tracking compliance requirements in multiple spreadsheets. You've invested in cutting-edge security tools. And yet, when the auditor asks a seemingly simple question—"Show me how your controls map to NIST CSF requirements"—you find yourself scrambling.
If this scenario sounds familiar, you're not alone. Security professionals consistently report that their biggest visualization challenges include "lack of actionable insight" and "difficulty finding specific pieces of critical information in vast datasets." The truth is, in today's complex multi-cloud environments, traditional approaches to security visualization simply can't keep pace.
The Core Challenge: Why is Seeing the "Big Picture" So Hard?
Visualizing security control relationships is difficult for several fundamental reasons:
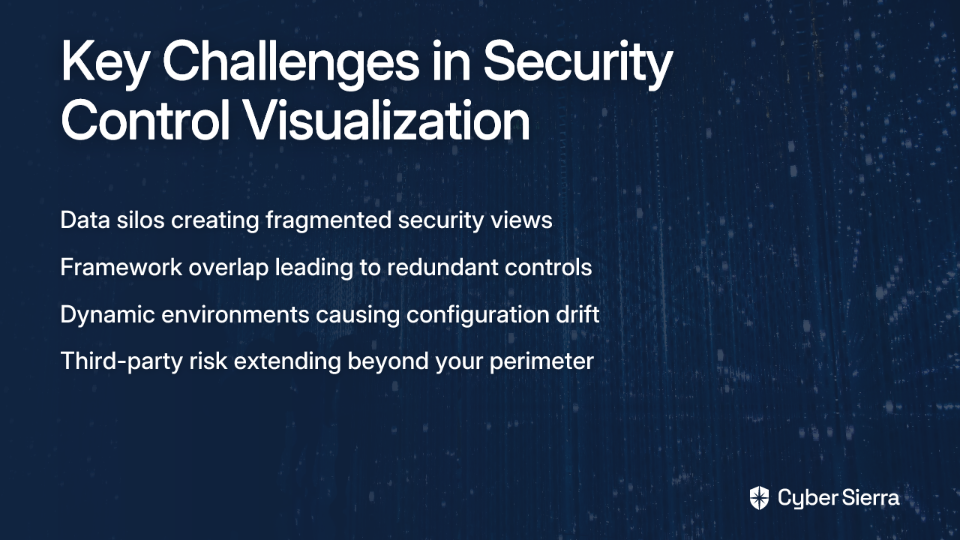
1. Data Silos Create Fragmented Views
Security telemetry is scattered across dozens of tools—SIEM platforms, vulnerability scanners, cloud security posture managers, and more. Each provides its own limited perspective, making a unified view nearly impossible without significant integration work.
2. Framework Overlap Creates Redundancy
Your organization might need to comply with ISO 27001, NIST CSF, GDPR, and PCI DSS simultaneously. Many controls satisfy requirements across multiple frameworks, but proving this overlap is typically a manual, error-prone process involving complex spreadsheet cross-referencing.
3. Dynamic Environments Lead to Configuration Drift
Cloud infrastructure defined by Infrastructure as Code (IaC) can change in minutes. A control that was effective yesterday might be misconfigured today, making point-in-time visualizations quickly obsolete. This creates what many security teams call "audit fatigue"—the exhaustion of constantly chasing compliance status.
4. Third-Party Risk Extends Beyond Your Perimeter
Your security controls don't exist in isolation. A critical vendor's weak security posture can directly impact your own, yet many organizations struggle to visualize these extended relationships. As one security professional noted, "Some of the most sensitive platforms don't even have 2FA on their logins," highlighting the challenge of third-party risk visibility.
From Pretty Pictures to Proactive Defense: The Benefits of Effective Visualization
When done right, visualizing security control relationships delivers tangible business and security outcomes:
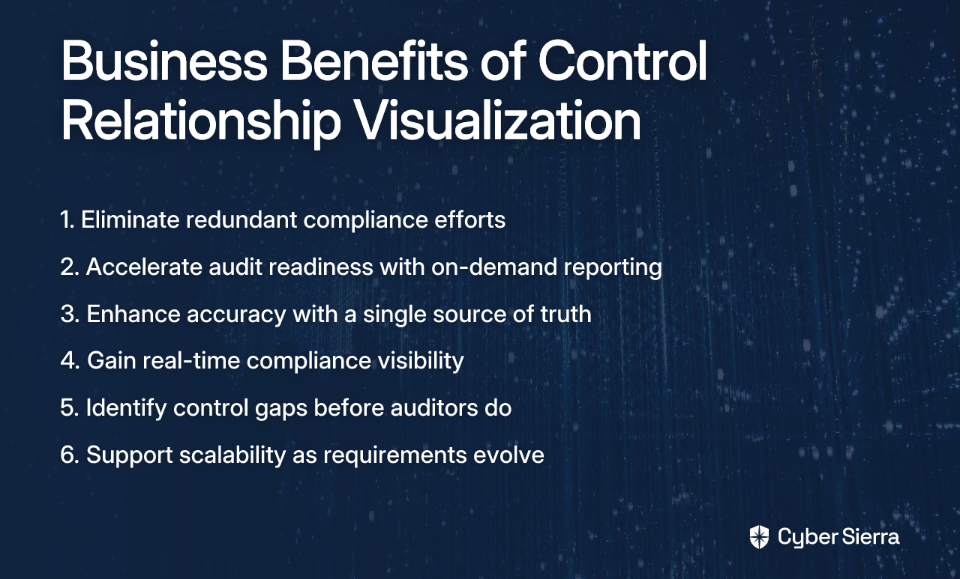
- Eliminate Redundant Efforts: Control mapping allows you to identify and reuse shared controls across multiple frameworks, saving hundreds of hours in compliance work.
- Accelerate Audit Readiness: Automated visualization enables on-demand reporting generation, addressing the widespread "desire for simplification and ease in audit reporting" expressed by security teams.
- Enhance Accuracy and Consistency: A centralized system of record minimizes the manual errors common with spreadsheets and provides a single source of truth.
- Improve Visibility and Reporting: Gain a real-time, dashboard-level overview of your entire compliance status instead of point-in-time snapshots.
- Identify Gaps and Overlaps: Clearly see where your control coverage is strong and where critical gaps exist before an auditor or attacker finds them.
- Support Long-Term Scalability: As you adopt new frameworks or enter new markets, a mapped control system can adapt easily without starting from scratch.
A Visual Toolkit: Key Techniques for Mapping Control Relationships
Different visualization techniques answer different security questions. Here are the most effective methods for understanding control relationships:
Graph Visualization (Node-Link Diagrams)
What it is: The ideal way to show complex, many-to-many relationships. Nodes represent entities (assets, controls, threats) and links represent their relationships.
Use Case: Unveiling densely connected threat intelligence to see how a single vulnerability (e.g., Log4j) impacts dozens of assets across different departments. It can also map how a single control satisfies requirements in multiple frameworks.
The Node-Link Diagram of the Cybersecurity Framework v2.0 is an excellent example of this technique in action. It clearly shows which controls satisfy multiple requirements, helping organizations identify high-value implementation priorities.
Hierarchical Visualization (Sunburst Charts)
What it is: Ideal for showing part-to-whole relationships and hierarchical structures.
Use Case: Breaking down a complex framework like the NIST CSF from its Core Functions (Identify, Protect, Detect, Respond, Recover) down to the individual Sub-Category level.
The Sunburst Visualization of the Cyber Security Framework v2.0 demonstrates this approach perfectly, providing an intuitive overview of framework structure.
Matrix Visualization (Adjacency Matrix)
What it is: A grid that shows the co-occurrence of items.
Use Case: Answering the question, "When Control X is implemented, which other controls are most often implemented alongside it?" This helps identify logical groupings and potential dependencies.
The Adjacency Matrix of Controls in the Cybersecurity Framework showcases this approach, revealing patterns that might otherwise remain hidden.
Timeline Visualization
What it is: Combines with other views to show cause and effect over time.
Use Case: Tracking the sequence of alerts across a network to understand an attack narrative, linking Indicators of Compromise (IoC) to MITRE ATT&CK tactics. This directly addresses the need for "actionable IoC visualizations" that lead to threat blocking.
A Practical Roadmap: From Manual Mapping to Continuous Monitoring
Now let's translate theory into practice with a step-by-step approach:
Step 1: Define Scope & Map Controls
Begin by identifying all relevant regulatory frameworks for your industry and geography (e.g., ISO 27001, NIST CSF, GDPR). Then, perform control mapping—the process of aligning multiple regulatory requirements to a unified set of internal controls, reducing redundancy and complexity.
For instance, a password policy requirement exists in virtually every framework, but with slight variations. Instead of managing separate controls, map them to a single robust password policy that satisfies all requirements.
Step 2: Centralize Your Controls and Evidence
The most critical step is moving away from disparate spreadsheets to a single source of truth or a central controls repository. This forms the foundation for automation.
A central repository stores not just the controls themselves, but links them to:
- The systems where they're implemented
- The evidence that proves they're working
- The compliance requirements they satisfy
- The risks they mitigate
Step 3: Implement Continuous Control Monitoring (CCM)
This is where visualization becomes truly powerful. Continuous Control Monitoring (CCM) represents the shift "away from point-in-time control testing to ongoing, evidence-driven visibility."
CCM operationalizes compliance by ingesting telemetry from your tools to track control effectiveness in near real-time. This addresses the challenge of "policy violation checks being performed after deployment" by providing continuous feedback on your security posture.
Unifying Your View: The Power of an Integrated Platform
While the steps above are powerful, implementing them manually is challenging. An integrated GRC and security platform can automate this entire process.
Platforms like Cybersierra offer specialized modules that work together to provide a comprehensive view of your security control relationships:
- Continuous Control Monitoring (CCM): Cybersierra's CCM module builds a central controls repository with near real-time updates from your infrastructure, providing clear visibility into your security posture. It automates control testing and validation, detecting exceptions in real-time—essential for maintaining an accurate visualization of your control effectiveness.
- Governance, Risk & Compliance (GRC): The GRC module automates data collection, risk assessments, and reporting for frameworks like SOC2, ISO 27001, and HIPAA. This directly addresses the "desire for simplification and ease in audit reporting" by generating comprehensive reports based on your visualized control relationships.
- Third-Party Risk Management (TPRM): For a truly complete picture, Cybersierra's TPRM module extends your control visualization beyond your own perimeter, providing continuous visibility into vendor security compliance.

Conclusion
Effective visualization of security control relationships isn't about creating pretty pictures—it's about transforming complex security data into actionable insights that drive better decision-making.
By implementing a visualization strategy that encompasses control mapping, centralization, and continuous monitoring, organizations can move from reactive compliance to proactive risk management. The future of security and compliance lies in these integrated approaches that provide a single, actionable view of risk across the entire enterprise.
Whether you're just starting with basic control mapping or ready to implement a comprehensive platform like Cybersierra, the key is to begin the journey toward visualization that delivers not just clarity, but actionable security intelligence.
Frequently Asked Questions
What is security control mapping?
Security control mapping is the process of aligning multiple regulatory and compliance requirements to a single, unified set of internal controls. This practice helps organizations eliminate redundant work by identifying and reusing shared controls across different frameworks like ISO 27001, NIST CSF, and GDPR. For example, instead of managing separate password policies for each framework, you can map them all to a single, robust policy that satisfies every requirement.
Why is visualizing security controls so important?
Visualizing security controls is crucial because it transforms complex, siloed security data into actionable insights that improve decision-making, accelerate audit readiness, and proactively identify security gaps. Without effective visualization, security teams struggle with fragmented views from different tools, leading to redundant compliance efforts and audit fatigue. A clear visual representation provides a single source of truth and allows you to see where control coverage is strong or weak before an auditor finds a problem.
How does Continuous Control Monitoring (CCM) improve security visualization?
Continuous Control Monitoring (CCM) enhances security visualization by providing ongoing, near real-time, evidence-driven visibility into the effectiveness of your security controls. While traditional visualizations are often point-in-time snapshots that quickly become outdated, CCM platforms automate control testing by ingesting live data from your infrastructure. This ensures that your visualizations are always current, allowing you to detect misconfigurations or policy violations as they happen.
What are the biggest challenges when visualizing security control relationships?
The biggest challenges include fragmented data across multiple security tools (data silos), overlapping requirements from different compliance frameworks, configuration drift in dynamic cloud environments, and a lack of visibility into third-party vendor risks. These issues make it difficult to get a unified, "big picture" view of an organization's security posture, as data silos prevent a holistic understanding and dynamic environments make manual assessments instantly obsolete.
Which visualization technique is best for my security data?
The best visualization technique depends on the specific security question you are trying to answer. For understanding complex, many-to-many relationships (like how one control maps to multiple frameworks), use Graph Visualizations. To show hierarchical structures (like breaking down the NIST CSF), use Hierarchical or Sunburst Charts. To identify co-occurrence and dependencies between controls, a Matrix Visualization is most effective.
How can my organization get started with visualizing security controls?
Your organization can start by defining the scope of relevant frameworks, mapping your internal controls to those requirements, and centralizing all controls and evidence into a single source of truth. The first step is to move away from scattered spreadsheets. Create a central repository for all controls, linking them to the systems they protect and the evidence of their effectiveness. This foundational work paves the way for more advanced steps like implementing Continuous Control Monitoring (CCM) for real-time visibility.