


Third Party Risk Management Software vs Spreadsheets: ROI Calculator
Join thousands of professionals and get the latest insight on Compliance & Cybersecurity.
Summary
- Relying on spreadsheets for Third-Party Risk Management (TPRM) creates hidden costs through manual labor and human error, exposing your organization to vendor-related breaches which average $4.88 million.
- Spreadsheets provide only a static snapshot of vendor risk, leaving you blind to dynamic threats and unable to scale your risk management program as your vendor list grows.
- Build a compelling business case for a dedicated solution by calculating the ROI, comparing the high cost of manual processes and unmanaged risk against the savings from automation and proactive mitigation.
- Cyber Sierra's TPRM platform automates the entire vendor risk lifecycle, from assessments to continuous monitoring, helping you move beyond manual spreadsheets.
Your vendor list has grown. Your risk register is a maze of tabs. And somewhere in a shared drive, there's an Excel file that three people have edited this month — and nobody's sure which version is current.
If you're managing Third-Party Risk Management (TPRM) in spreadsheets, you already know the cracks are showing. What you need now is the language to convince your CFO that the status quo has a price tag — and it's higher than the cost of replacing it.
This article gives you a practical ROI framework to quantify the real cost of spreadsheet-based TPRM and build a business case that speaks in numbers, not feelings.
The True Cost of "Free" Spreadsheets
Spreadsheets feel cheap. There's no license fee, no onboarding project, no procurement approval. But that perception only holds if you ignore what they actually cost to run — and what they cost when they fail.
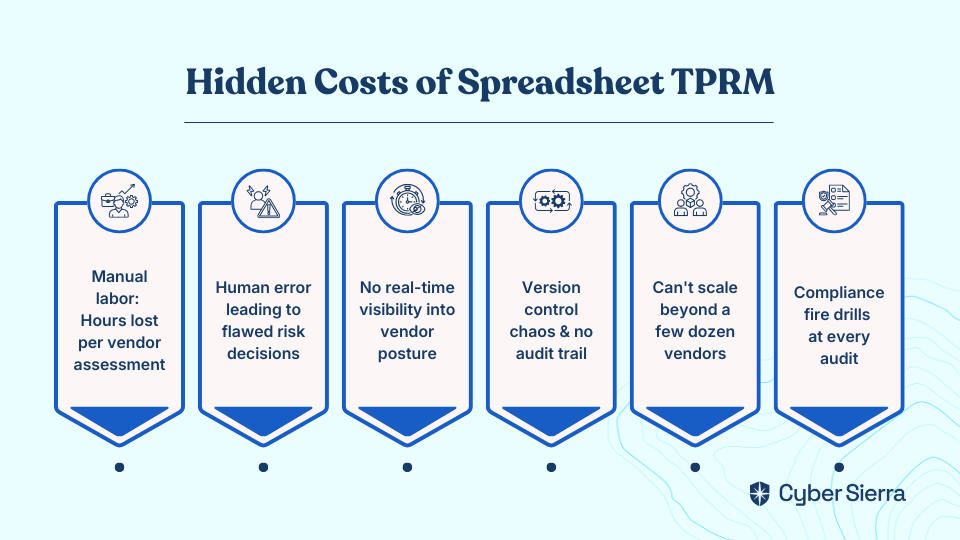
Here's where the hidden costs accumulate:
- Expensive manual labor. Every vendor assessment means someone is sending a questionnaire, chasing a response, manually reviewing evidence, and copying data into a cell. As FinoSec notes, spreadsheets require continuous manual input that dramatically increases team workload. As one practitioner noted on Reddit, "Ironically the effort and opportunity cost would probably exceed the cost of a dedicated tool."
- Human error with real consequences. Manual data entry, formula drift, and copy-paste mistakes lead to inaccurate risk assessments and flawed decisions. A miscategorized vendor can slip through your controls entirely.
- No real-time visibility. Spreadsheets are static. UpGuard's analysis makes this explicit: they "only capture data at specific intervals, missing dynamic risk changes." What you see in that spreadsheet isn't today's risk — it's the risk from whenever someone last updated the file.
- Version control chaos. The moment a spreadsheet is shared, you have a version problem. Multiple editors, conflicting updates, and no audit trail means you can never be confident you're looking at the authoritative record.
- Inability to scale. According to OneTrust, two-thirds of companies report over 5,000 third-party relationships. Spreadsheets were not built for that volume.
- Compliance fatigue at audit time. Manually tracking vendor compliance against frameworks like SOC 2, ISO 27001, or GDPR means audit prep is always a fire drill — scrambling to collect evidence, reconciling discrepancies, and hoping nothing falls through the cracks.
The bottom line: spreadsheets aren't free. They're just billing you in hidden labor costs, operational friction, and unquantified risk exposure.
What Dedicated TPRM Software Actually Does Differently
Before building your ROI case, it helps to be precise about what you're comparing against.
Gartner defines TPRM as tools that help organizations identify, assess, manage, monitor, and report on risks associated with vendors — continuously, not periodically. That last word is the key differentiator.
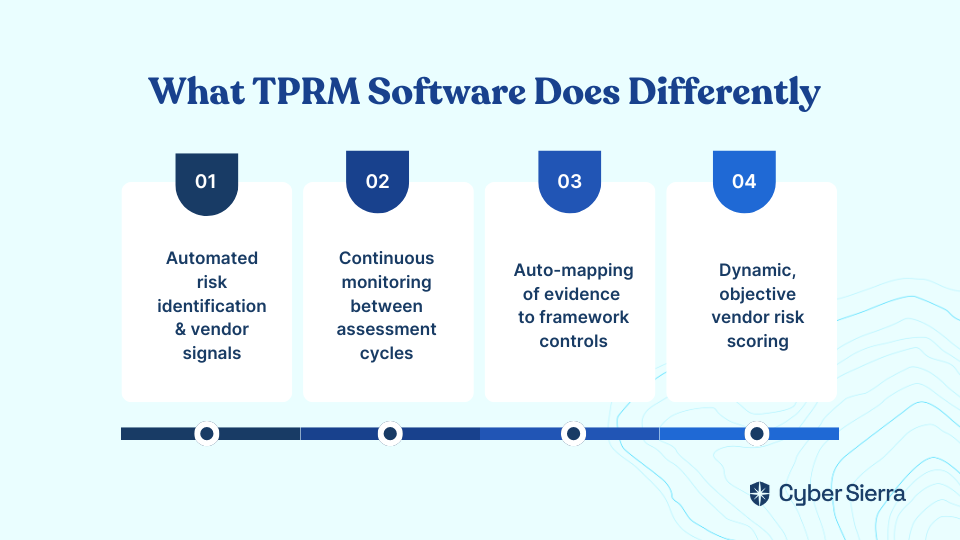
Where spreadsheets require a human to initiate every step, dedicated third party risk management software automates the heavy lifting:
- Automated risk identification. Software continuously pulls signals on vendor risk posture rather than waiting for a human to send another questionnaire.
- Continuous monitoring. Real-time alerts surface emerging vendor risks between formal assessment cycles — the window where spreadsheets go completely blind.
- Streamlined compliance mapping. Vendor evidence is automatically mapped to relevant framework controls, eliminating the manual cross-referencing that consumes hours before every audit.
- Automated risk scoring and reporting. Vendor risk scores are calculated objectively and updated dynamically, rather than derived from whatever formula someone built into a cell two years ago.
This isn't a feature comparison. It's a fundamentally different operating model for vendor risk.
How To Build Your TPRM ROI Calculator
This framework is designed to generate numbers you can put in front of a CFO. Work through each step with your own data. The more precise your inputs, the stronger your business case.
Part 1: The Cost of Inaction (Current State with Spreadsheets)
Start by quantifying the hidden costs and risks associated with your current spreadsheet-driven process.
1. Calculate Annual Labor Costs for Vendor Assessments
Start with the hours your team actually spends on assessments — not just the questionnaire, but everything that surrounds it: sending the request, chasing the response, reviewing the answers, entering data, and reconciling discrepancies.
Formula: (Avg. hours per vendor assessment) × (Number of vendors assessed annually) × (Avg. hourly salary of analyst) = Total Annual Assessment Cost
If a mid-level risk analyst earns around $50/hour and each assessment takes 6 hours across 100 vendors, that's $30,000 per year in assessment labor alone — before you account for manager review time or escalations.
2. Estimate the Annual Cost of Inefficiency
Now quantify the time that doesn't show up in any formal process: correcting formula errors, chasing the right spreadsheet version, manually compiling board reports, and re-doing work because data was stale.
Formula: (Hours lost to inefficiency per week) × 52 × (Avg. hourly salary) = Annual Cost of Inefficiency
Even two hours per week lost to spreadsheet friction adds up to over 100 hours — and roughly $5,000 per analyst per year. For a team of three, that's $15,000 evaporating silently every year.
3. Quantify the Financial Exposure from Unmanaged Vendor Risk
This is the number that tends to get a CFO's attention. Spreadsheets don't provide continuous visibility into vendor posture, which means gaps can persist for months undetected.
Consider the potential financial exposure from a vendor-related incident:
- Regulatory fines. A vendor failure that leads to a GDPR breach can trigger fines up to €20 million or 4% of global annual turnover — whichever is higher.
- Breach costs. According to IBM's 2024 report, the average total cost of a data breach reached $4.88 million. Third-party involvement consistently ranks among the top factors that drive costs higher.
You don't need to predict a breach to use this number. You need to establish what the expected cost is given your current vendor risk exposure — and then show how better visibility reduces that exposure.
Total Cost of Inaction: (Annual Assessment Cost) + (Annual Cost of Inefficiency) + (Risk-Weighted Exposure from Unmanaged Vendor Risk) = Your Baseline
Part 2: The Return on Investment (Future State with TPRM Software)
Next, calculate the projected gains and cost avoidance you can achieve by automating your TPRM program.
1. Calculate Productivity Gains from Automation
Dedicated TPRM software typically reduces manual assessment effort by 50–75% through automated questionnaire distribution, response tracking, and evidence collection. Apply a conservative estimate to your own baseline.
Formula: (Total Annual Assessment Cost) × (Estimated % time saved) = Annual Productivity Savings
Using the earlier example: $30,000 × 60% = $18,000 in annual productivity savings — freeing your analysts to focus on higher-value risk analysis rather than spreadsheet administration.
2. Estimate Cost Avoidance Through Proactive Risk Mitigation
Continuous monitoring means vendor risk gaps are identified and remediated before they become incidents. While this is harder to assign a precise dollar figure, it directly reduces your risk-weighted exposure calculated in Part 1.
Frame it this way for your CFO: if your current exposure is estimated at $X, and continuous monitoring meaningfully reduces the probability of an undetected vendor incident, what percentage reduction in exposure is worth paying for?
3. Calculate Your Net ROI
Now combine the figures:
Formula: [(Annual Productivity Savings + Annual Cost Avoidance) − Annual Cost of TPRM Software] ÷ (Annual Cost of TPRM Software) × 100 = ROI %
To complete this calculation, you'll need a software cost figure. Since vendor pricing varies, get a quote tailored to your vendor volume and program maturity. Cyber Sierra offers flexible plans tailored to enterprise needs — visit the pricing page for details.
Presenting the Business Case to Your CFO
Running the numbers is step one. Getting buy-in is step two — and that requires framing the ROI in terms your CFO already cares about.
A few principles that make the difference:
- Lead with cost avoidance, not just savings. CFOs respond to risk in financial terms. The potential regulatory fine or breach cost is often more compelling than the labor efficiency argument alone.
- Show cross-departmental value. TPRM software isn't just a security tool. OneTrust's buy-in guide highlights that finance teams gain visibility into vendor ROI, procurement teams benefit from faster due diligence, and executive teams get the board-level reporting they need to make informed strategic decisions. The investment generates returns across functions.
- Present a simple before/after comparison. Take your "Total Cost of Inaction" figure and place it next to your projected "Net Annual Value with TPRM Software." A single chart — current state versus future state — speaks louder than a paragraph of explanation.
- Acknowledge the maturity argument. Some CFOs will push back with: "Our spreadsheets work fine." The honest response: they work fine at low volume, with disciplined teams, and in the absence of a regulatory incident. The question isn't whether spreadsheets have worked so far — it's whether they can scale with your vendor base and withstand the scrutiny of a real audit or breach investigation.
One thing worth noting: the community consensus among practitioners is that "discipline > software" — a well-maintained baseline with clear accountability will always outperform an expensive tool that nobody updates. Your CFO case shouldn't promise that software replaces discipline. It should demonstrate that software makes discipline scalable.
From Manual Overhead to Strategic Advantage
The spreadsheet maze you're navigating isn't just an operational headache; it's a financial liability hiding in plain sight. Armed with the right data, you can reframe the conversation from "we can't afford a tool" to "we can't afford the risk of spreadsheets."
Here are the key takeaways to build your case:
- Quantify the invisible costs: Your spreadsheets aren't free. Calculate the hours your team loses to manual assessments and the financial exposure from static, outdated risk data.
- Speak in terms of risk reduction: Frame your argument around cost avoidance (breach costs, regulatory fines) and operational efficiency—metrics that resonate with financial decision-makers.
Your next step today is simple: calculate just one part of the ROI formula—your team’s annual labor cost for vendor assessments. That single number is often enough to start a real conversation.
When you're ready to replace those hidden costs with real-time visibility and automated workflows, request your personalized demo.
Frequently Asked Questions
Why are spreadsheets not recommended for third-party risk management?
Spreadsheets are not recommended because they create hidden costs through manual labor, human error, and a lack of real-time risk visibility. They are difficult to scale, lack proper version control, and complicate audit preparation, increasing operational friction and unmanaged risk exposure.
What is the main advantage of TPRM software over spreadsheets?
The main advantage of TPRM software is automation and continuous monitoring. Unlike static spreadsheets that require manual updates, dedicated software automates vendor assessments, provides real-time alerts on emerging risks, and streamlines compliance tracking for a dynamic view of your risk posture.
How can I calculate the ROI of a TPRM tool?
To calculate ROI, first determine the "cost of inaction" by summing up annual labor costs, inefficiency costs, and risk-weighted financial exposure from using spreadsheets. Then, subtract the annual software cost from the projected productivity savings and cost avoidance to find your net return.
When should a company switch from spreadsheets to a TPRM solution?
A company should switch when manual processes become unsustainable. Key indicators include a growing vendor list (over 30), increasing regulatory scrutiny, version control issues, and significant time spent on manual assessment tasks that could be automated to reduce risk and improve focus.
What are the hidden costs of using spreadsheets for TPRM?
The hidden costs include extensive manual labor for assessments, financial exposure from human errors, a lack of real-time visibility into vendor risk, version control chaos without an audit trail, and inefficient "fire drills" during compliance audits. These costs far exceed the "free" price tag.
How does TPRM software improve compliance and audit readiness?
TPRM software improves audit readiness by automatically mapping vendor evidence to specific compliance framework controls (like SOC 2 or ISO 27001). This creates a centralized, auditable record, eliminating the last-minute scramble to gather documentation and prove compliance.