Top 7 Ways Visual Risk Dashboards Improve Board-Level Communication
Join thousands of professionals and get the latest insight on Compliance & Cybersecurity.
Summary
- CISOs often struggle to translate technical security data into business terms, leading to misaligned priorities and strategic vulnerabilities when boards cannot make informed decisions.
- Visual risk dashboards bridge this communication gap by converting complex metrics into intuitive, business-relevant visuals like heat maps and color-coded statuses.
- By providing a real-time, holistic view of organizational risk, dashboards enable proactive management, align security with business goals, and streamline compliance reporting.
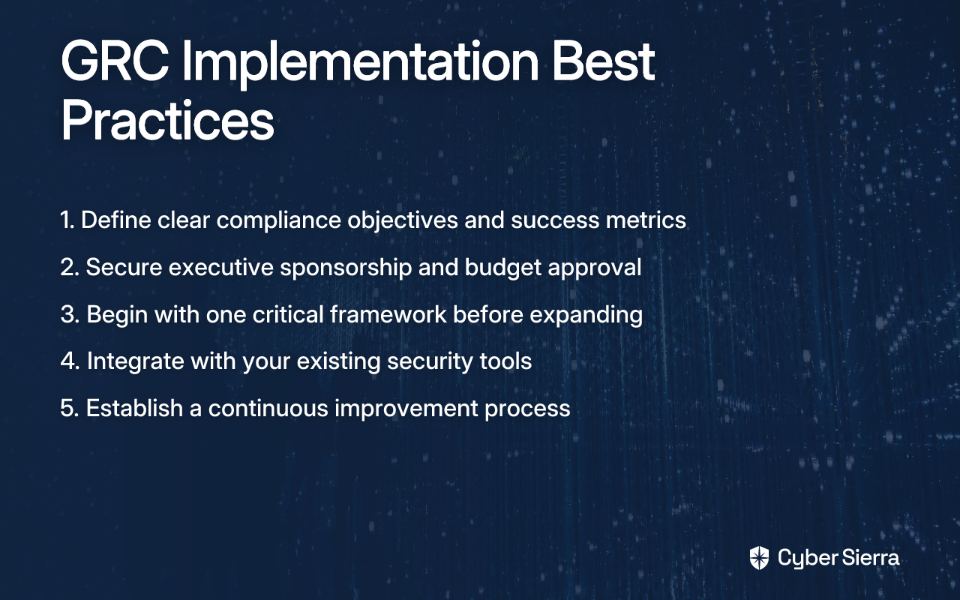
- Implementing an integrated Governance, Risk & Compliance (GRC) platform automates data consolidation, providing the actionable intelligence needed to elevate board-level conversations.
You've prepared your cybersecurity briefing for the board meeting. After weeks of gathering data, analyzing vulnerabilities, and documenting compliance statuses, you're ready to present. Ten minutes in, you notice the glazed eyes. The board members are nodding politely, but the technical details are clearly not resonating. When the Q&A begins, their questions reveal they've missed your core message entirely.
Sound familiar? You're not alone.
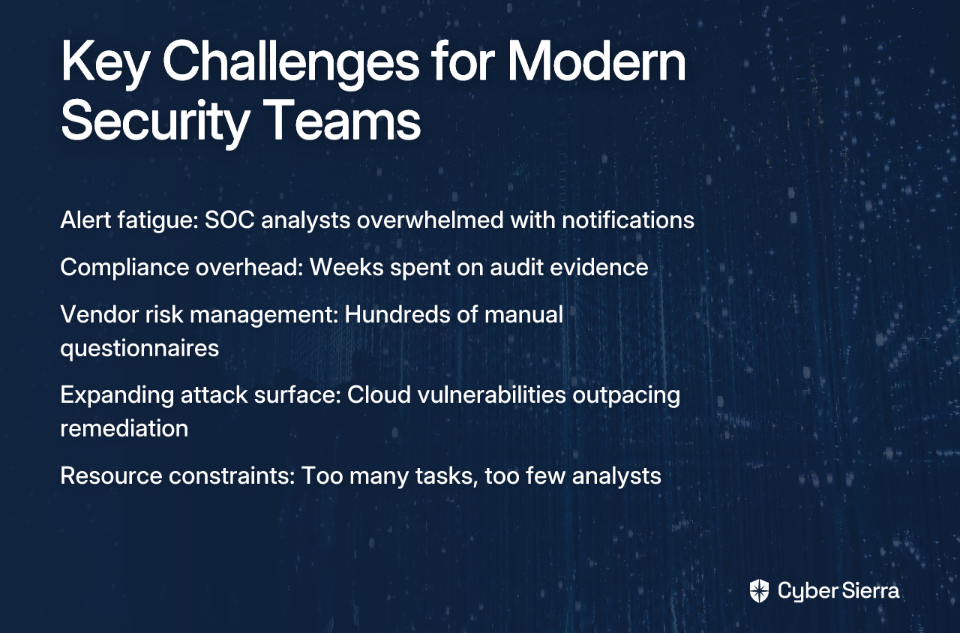
CISOs and security leaders face a fundamental challenge: translating complex technical information into business insights that resonate with executives who speak a different language. As one security professional noted, "keeping it at the high-level is so important to maintain that engagement from board members who don't have specific backgrounds in cyber security."
The problem isn't just a communication gap—it's a strategic vulnerability. When boards don't fully grasp security risks, they can't make informed decisions about resource allocation, risk tolerance, or strategic initiatives. This disconnect leads to misaligned priorities and inadequate support for critical security measures.
Visual risk dashboards offer a powerful solution. Rather than drowning board members in technical jargon or overwhelming them with raw data, these dashboards translate complex security information into clear, intuitive visuals that tell a compelling story about organizational risk.
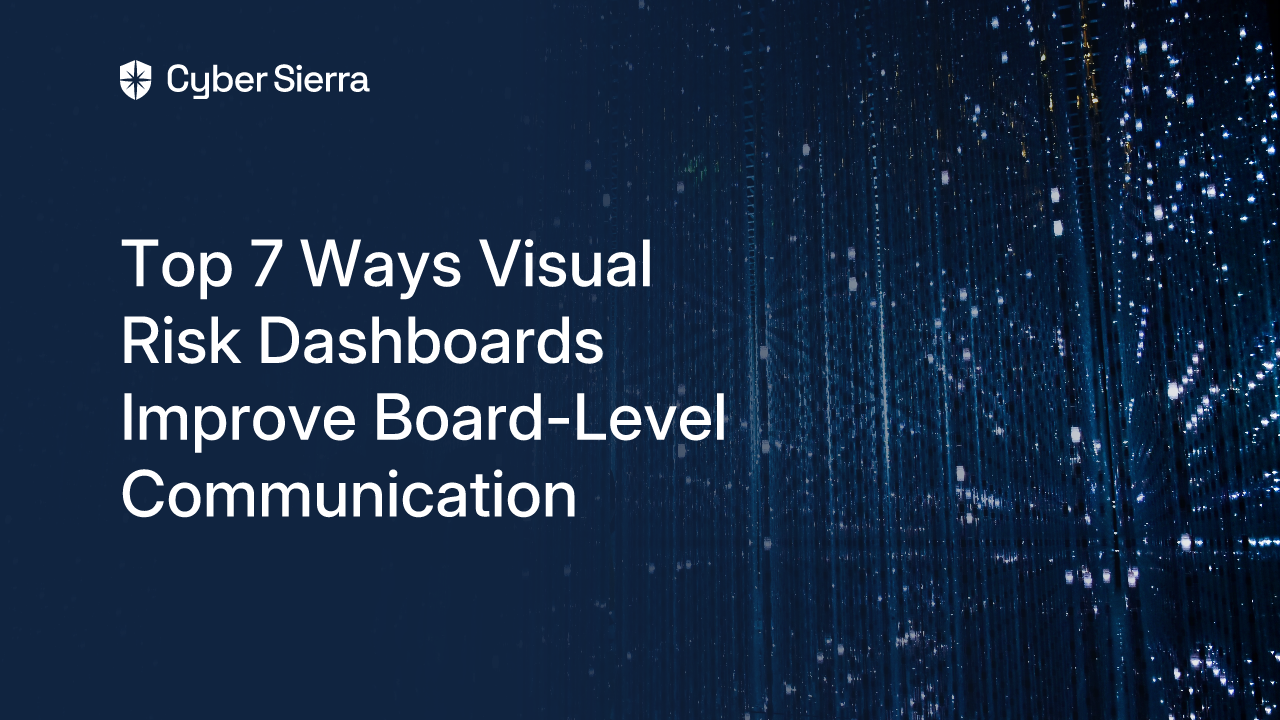
Let's explore the seven key ways visual risk dashboards transform board-level communication, turning technical complexity into strategic clarity.
1. Translates Complex Data into a Common Business Language
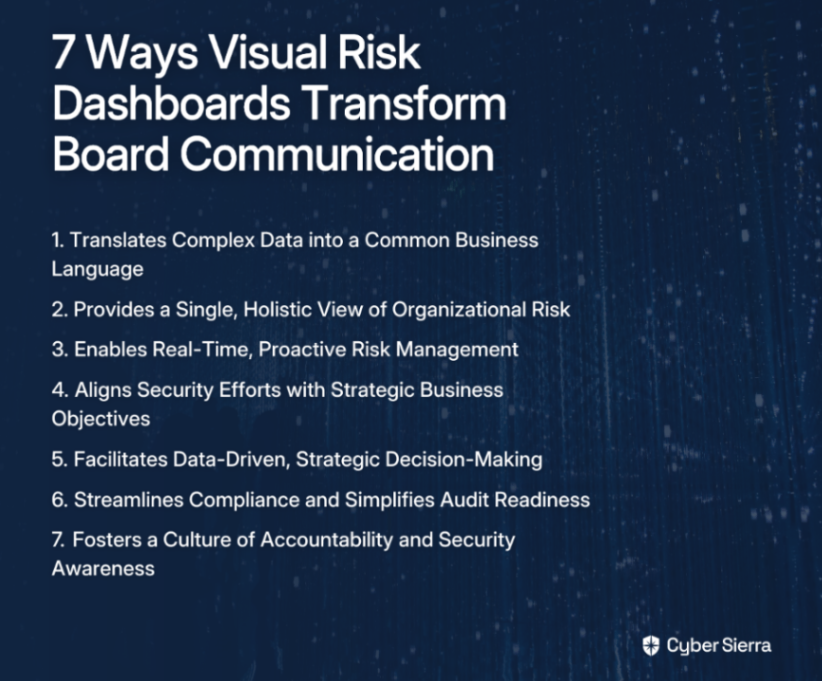
Security teams speak in vulnerabilities, patches, and controls. Board members speak in financial impact, strategic goals, and business risk. Visual dashboards bridge this divide by converting technical metrics into business-relevant visuals.
Instead of presenting spreadsheets of vulnerability data, effective dashboards use heat maps, trend charts, and simple color-coded statuses (Red/Amber/Green) to instantly convey risk levels. This visual approach strips away technical complexity without sacrificing meaningful insights.
As noted in research by NC State University, "Visual risk dashboards transform complex data into easily digestible formats, enhancing the ability of board members to make informed decisions quickly." This visual translation keeps discussions focused on business relevance rather than technical implementation.
For example, rather than reporting "27 critical vulnerabilities detected in the CRM system," a dashboard might display a red indicator for "Customer Data Risk" with a trend line showing increasing exposure—a message that resonates instantly with business leaders.
2. Provides a Single, Holistic View of Organizational Risk
Organizational risk spans multiple domains—from financial and operational to compliance and reputational. Yet these risks are often managed in silos, creating dangerous blind spots at the executive level.
A comprehensive visual dashboard consolidates data from disparate sources—vulnerability scans, compliance trackers, asset inventories, and vendor assessments—into a unified view. This eliminates fragmentation and provides executives with the complete risk picture needed for strategic oversight.
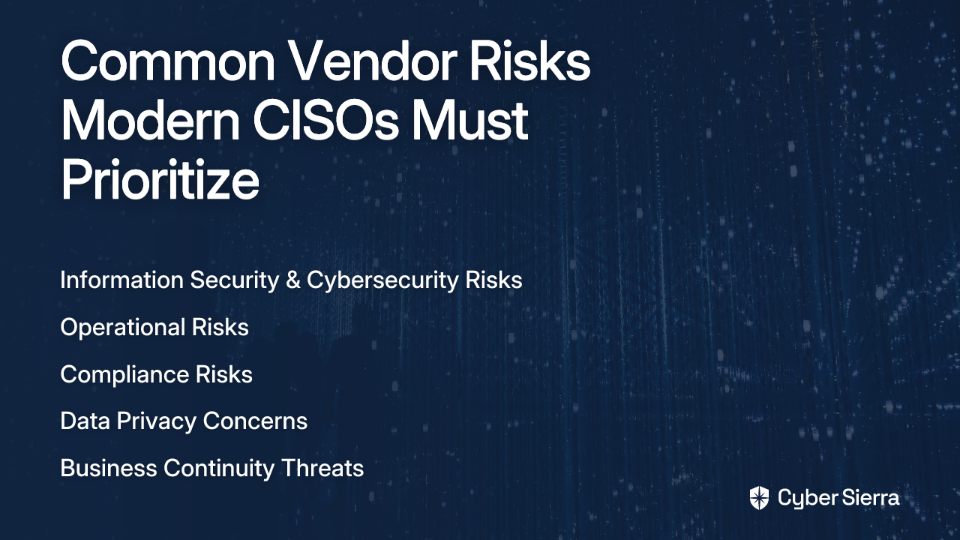
This holistic view is particularly vital for Third Party Risk Management (TPRM). With 35% of directors concerned about third-party data breaches, visualizing supply chain risk exposure in context with other security domains provides crucial perspective.
Integrated platforms like Cybersierra combine data from multiple security functions, including Continuous Control Monitoring (CCM) and Third-Party Risk Management, to deliver this comprehensive risk landscape to decision-makers.
3. Enables Real-Time, Proactive Risk Management
Static quarterly reports are increasingly inadequate in today's dynamic threat landscape. By the time a traditional report reaches the board, the information is already outdated. Visual dashboards provide near real-time insights, allowing executives to understand the current risk posture, not the posture from three months ago.
This real-time visibility shifts the organization from reactive to proactive. Boards can observe emerging threats, track remediation progress, and identify concerning patterns as they develop. For example, if a dashboard shows a sudden spike in failed Multi-Factor Authentication (MFA) attempts across executive accounts, leadership can immediately discuss potential targeted attacks rather than waiting for the next quarterly security review.
As one security practitioner mentioned in an online discussion, having "alerts on for when things flag a control that's not up to standard" is valuable for maintaining continuous awareness of compliance status. This is the essence of Continuous Compliance Monitoring (CCM)—moving from periodic assessment to ongoing vigilance.
Modern platforms automate data collection and dynamically update risk scores, ensuring that decision-makers are always working with current information. This transforms cybersecurity from a point-in-time activity to a continuous business process aligned with the pace of modern threats.
4. Aligns Security Efforts with Strategic Business Objectives
One of the most common board frustrations is the disconnect between security initiatives and business strategy. Visual dashboards address this by explicitly mapping security metrics to strategic objectives.
This means moving beyond "vanity metrics" like total vulnerabilities patched to meaningful Key Performance Indicators (KPIs) that demonstrate business impact. For example, rather than reporting on technical details of a security implementation, dashboards can visualize:
- Risk reduction in new product launches
- Security readiness for market expansion
- Compliance status for entering regulated industries
- Vendor risk exposure in strategic partnerships
When security is presented in the context of business goals, it transforms from a technical function to a strategic enabler. This contextual approach resonates with board members who need to see how security investments support overall organizational objectives.
As noted in a comprehensive guide on risk dashboards, "Risk metrics can be aligned with organizational objectives, ensuring that risk monitoring supports strategic plans." This alignment is essential for securing board-level engagement and support.

5. Facilitates Data-Driven, Strategic Decision-Making
A well-designed dashboard doesn't just present data—it facilitates conversation and decision-making. Interactive dashboards allow users to drill down from high-level summaries to investigate specific areas of concern, enabling dynamic exploration during board discussions.
For example, if a dashboard shows elevated risk in the company's European operations, board members can immediately drill into the specifics—perhaps discovering that new GDPR compliance requirements are driving the increased risk score. This interactive capability transforms static presentations into collaborative problem-solving sessions.
By visualizing risk exposure against risk appetite, dashboards provide the clarity needed for informed decisions about:
- Security budget allocations
- Risk acceptance vs. mitigation choices
- Technology investment priorities
- Resource deployment across the organization
This data-driven approach elevates security discussions from subjective opinions to evidence-based decision-making. As one study notes, dashboards "encourage collaborative decision-making by providing all board members with access to the same information," creating a shared foundation for strategic security governance.
6. Streamlines Compliance and Simplifies Audit Readiness
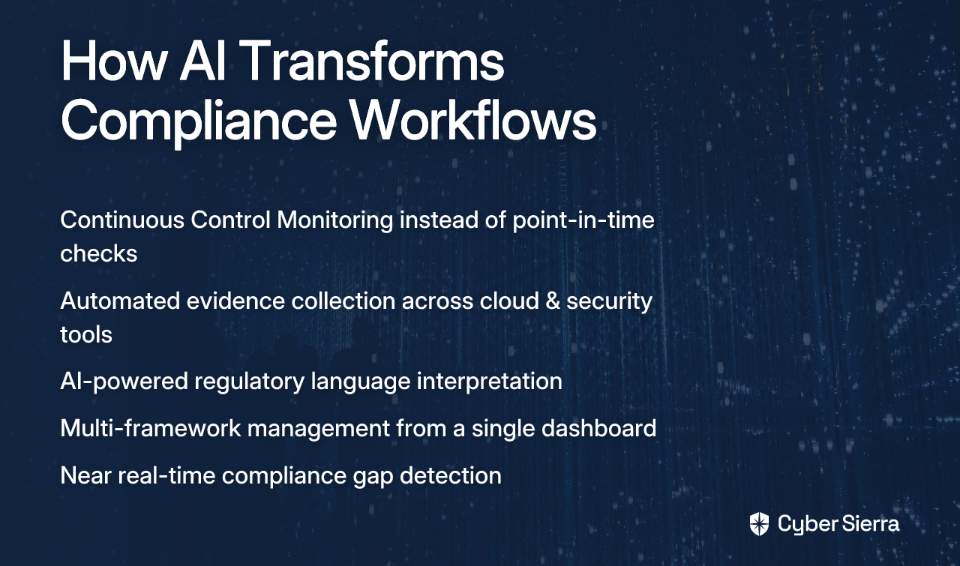
Managing compliance across multiple frameworks (SOC 2, ISO 27001, GDPR, HIPAA) is a massive undertaking that often consumes significant security resources. Visual dashboards can dramatically simplify this complexity by providing clear visibility into compliance status across all relevant frameworks.
Effective dashboards map controls to various regulatory requirements, automate evidence collection, and highlight areas of non-compliance. This visualization transforms compliance from a stressful, manual, point-in-time event to a continuous, manageable process—a key aspect of audit readiness.
For board members concerned about regulatory risk, these visualizations provide immediate answers to critical questions:
- Are we compliant with industry regulations?
- Where are our compliance gaps?
- How quickly can we remediate issues?
- What's our audit readiness status?
This capability is particularly valuable given the increasing board-level focus on compliance risk. As one survey respondent noted, maintaining "audit readiness" is a primary concern for security teams implementing continuous monitoring solutions.
Platforms with Governance, Risk & Compliance (GRC) capabilities can automate data collection, provide continuous control monitoring, and maintain detailed audit trails. This dramatically reduces the administrative burden while keeping the organization perpetually prepared for regulatory scrutiny.
7. Fosters a Culture of Accountability and Security Awareness
When risk is visualized and clearly communicated at the board level, it ceases to be "an IT problem" and becomes a shared organizational responsibility. Visual dashboards provide transparency into risk ownership, highlighting which business units or executives are accountable for specific risk areas.
This transparency drives accountability throughout the organization. When the board can clearly see which departments have outstanding high-risk vulnerabilities or compliance gaps, it naturally creates pressure to address these issues promptly. Conversely, when strong security performance is visible, it can be recognized and rewarded.
Beyond accountability, this visibility fosters broader security awareness. Board members who regularly review security dashboards develop a deeper understanding of the organization's security posture, making them more effective advocates for security initiatives and investments.
This top-level engagement is crucial for cultivating a proactive, risk-aware culture throughout the company. It reinforces the message that security is everyone's job—from the boardroom to the breakroom.
Conclusion: From Information to Insight
Visual risk dashboards are far more than pretty pictures—they're strategic communication tools that transform complex security data into business insights. By bridging the language gap between technical teams and the board, these dashboards enable more informed governance, better resource allocation, and stronger security outcomes.
The seven benefits we've explored—translating technical complexity, providing holistic visibility, enabling proactive management, aligning with business strategy, facilitating data-driven decisions, streamlining compliance, and fostering accountability—collectively transform how organizations understand and manage cybersecurity risk at the highest levels.
In an era of increasing cyber threats and regulatory pressure, clear board-level communication isn't just helpful—it's essential for organizational resilience. The right visual dashboard doesn't merely inform; it empowers leadership to make strategic security decisions with confidence.
Achieving this level of visibility requires a powerful, integrated platform that can collect, analyze, and visualize security data from across the organization. Solutions like Cybersierra bring together Continuous Control Monitoring, Third-Party Risk Management, Governance, Risk & Compliance, and more to provide the actionable intelligence needed to elevate your board-level conversations.
By implementing effective visual risk dashboards, security leaders can transform technical complexity into strategic clarity—ensuring that the board not only sees the pretty pictures but understands the profound story they tell about organizational risk.
Frequently Asked Questions
What is a visual risk dashboard and why is it important for board communication?
A visual risk dashboard is a strategic tool that translates complex security and compliance data into easily understandable graphical representations. It is critically important for board communication because it bridges the language gap between technical security teams and non-technical executives, allowing leaders to grasp the organization's risk posture quickly and make informed, data-driven decisions.
How do visual risk dashboards translate complex security data for a non-technical audience?
Visual risk dashboards translate complex data by using intuitive visual elements like color-coded statuses (Red/Amber/Green), heat maps, trend lines, and summary charts. Instead of showing raw numbers like "1,500 low-level vulnerabilities," a dashboard presents this information as a "Low" risk rating for a specific business unit, focusing on business impact rather than technical minutiae.
What key metrics should a cybersecurity dashboard for the board include?
A board-level cybersecurity dashboard should focus on high-level, business-relevant metrics rather than granular technical data. Key metrics often include an overall organizational risk score, compliance status against key regulations (like SOC 2 or GDPR), third-party and supply chain risk levels, progress on major security initiatives, and alignment of security posture with the company's stated risk appetite.
Why are real-time dashboards better than traditional static security reports?
Real-time dashboards are superior to static reports because they provide a current, dynamic view of the organization's risk posture, whereas traditional reports are outdated the moment they are printed. This allows for proactive risk management, enabling the board to see emerging threats and track remediation progress as it happens, rather than reacting to historical data from weeks or months ago.
How can a risk dashboard help with compliance and audit readiness?
A risk dashboard streamlines compliance and audit readiness by providing a centralized, continuous view of your compliance status across multiple frameworks. It automates the collection of evidence, maps controls to different regulatory requirements, and visually highlights any gaps or areas of non-compliance, ensuring the organization is perpetually prepared for audits and regulatory scrutiny.
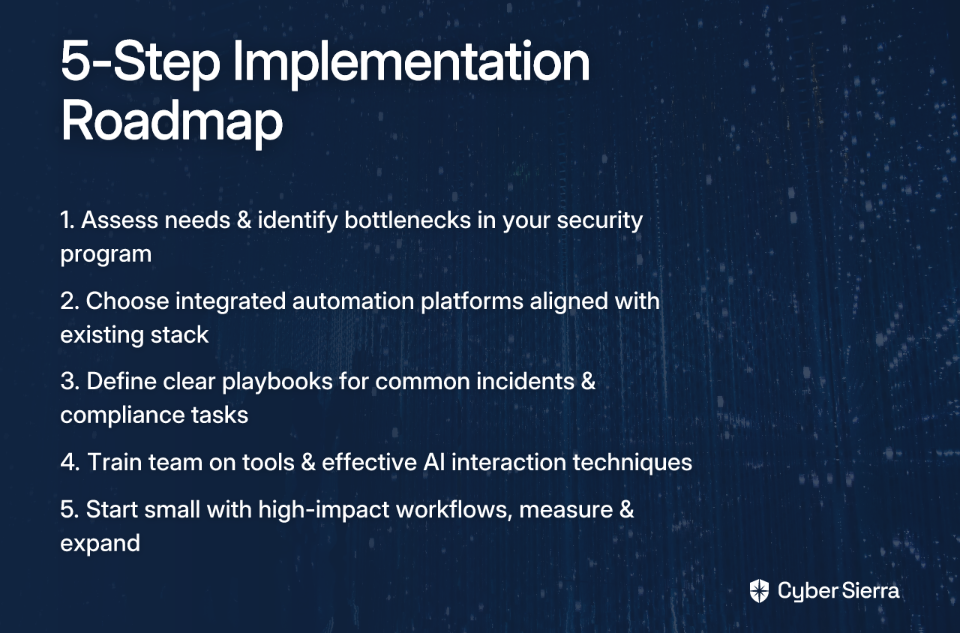
What are the first steps to implementing a visual risk dashboard for my board?
The first steps to implementing a visual risk dashboard involve understanding your audience and objectives. Start by identifying key business goals and risks that matter to your board, then define the Key Performance Indicators (KPIs) that best represent them. Finally, choose an integrated GRC platform, like Cybersierra, that can consolidate data from various sources and present it in a clear, actionable format tailored for executive leadership.
Ready to transform your board-level security communications? Book a demo to see how an integrated risk management platform can elevate your security governance.